

What the twelve months show
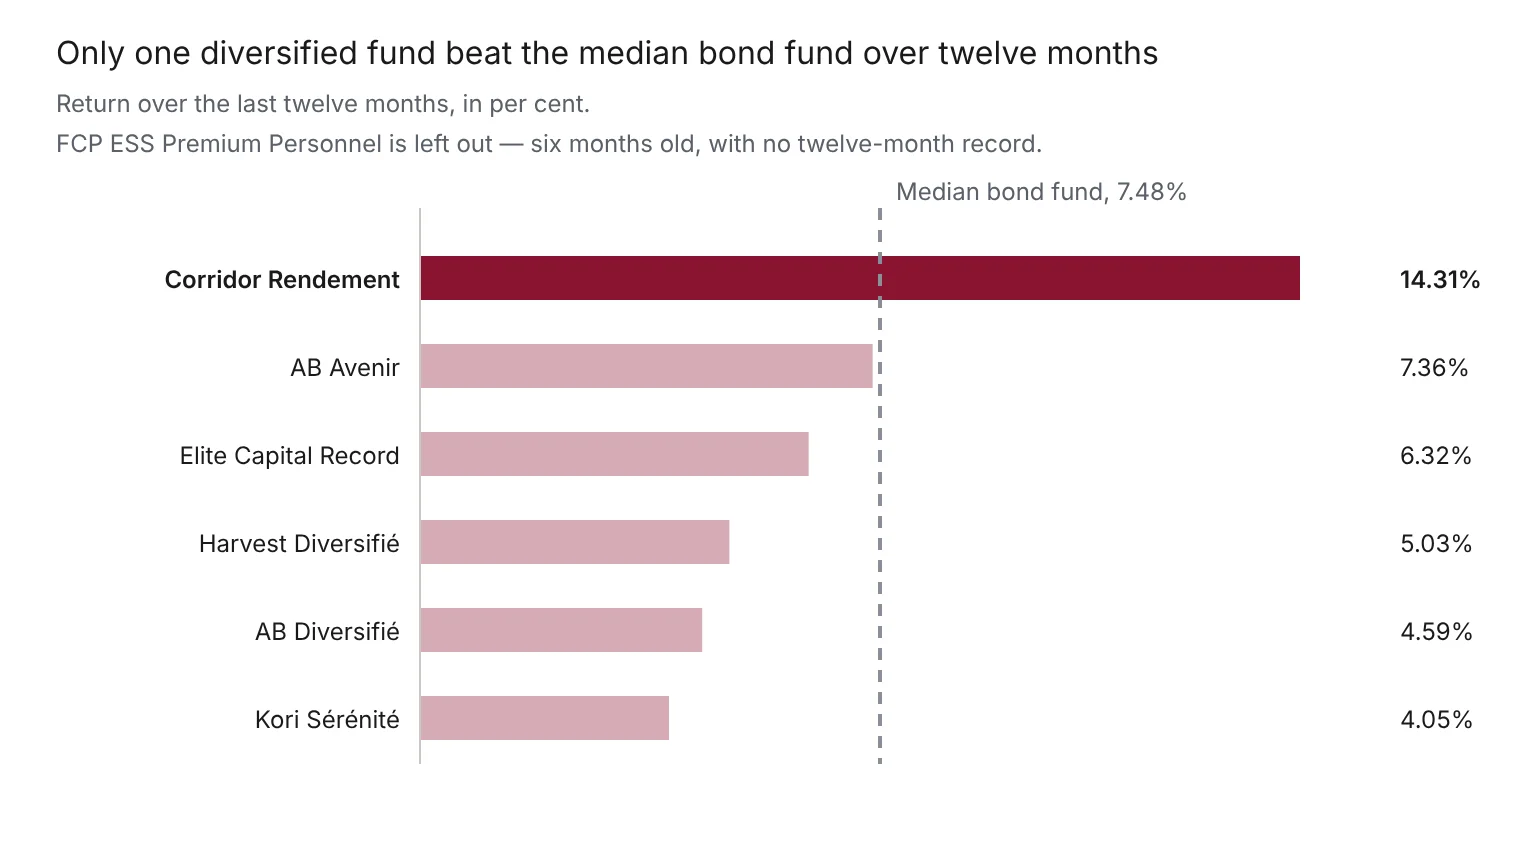
Set the two lists beside each other. The ten bond funds on the BVMAC list returned an average of 7.60% over the last twelve months, with a median of 7.48%. The six diversified funds with a twelve-month record returned an average of 6.94%.
Take out Corridor Rendement, the one fund that ran away from the group, and the other five average 5.47%.
That is more than two percentage points below what the bond funds paid — for a product that holds shares as well as bonds, and can therefore fall further when markets turn. FCP Kori Sérénité already shows a negative month on this table, at −0.33%.
The one that did better, and what it cost
FCP Corridor Rendement returned 14.31% over the last twelve months. Nothing on either list came close.
It is also the oldest fund in the group, at 6.9 years, and across that whole life it has averaged 7.29% a year.
Both numbers belong to the same fund, and together they describe what a diversified fund actually does. It has years like the last one, it has years that give much of that back, and the average of those years is 7.29%.
For comparison, FCP Ecobank Obligataire CEMAC has been running 6.3 years — close enough to set beside it — and has averaged 6.73% a year holding bonds alone.
So over comparable stretches, the diversified fund has paid about half a percentage point more each year. That is the price this market is putting on the share risk inside it. Whether half a point is worth it to you is the whole question.
Why the top of the table is misleading
Sorted by return since launch, two funds sit above everything else. FCP Kori Sérénité shows 11.23% a year, and FCP Harvest Diversifié shows 8.92%.
Both are 1.3 years old.
Now look at what each returned over the last twelve months. Kori Sérénité returned 4.05%. Harvest Diversifié returned 5.03%. Those are two of the three weakest figures on the list.
A return since launch is an average across a fund's whole life. When that life is barely longer than a year, a strong opening stretch lifts the average and keeps it lifted. It describes the first few months rather than how the fund is running now.
The same shape appears among the bond funds. Any since-launch figure under about two years is better treated as a number waiting for evidence than as a record.
The fair objection
Bonds had a good year.
When interest rates ease, bonds already held become more valuable, and every bond fund benefits at once. Eight of the ten bond funds beat their own long-run average over the last twelve months. This comparison is being made in a window that favoured one side.
That matters, and it is why the finding here is not "never buy a diversified fund."
What it does not do is rescue the other five. A diversified fund holds bonds too, so it should have caught some of the same tailwind — and five of six still finished behind. On this evidence the share portion did not simply fail to add; it appears to have held them back.
What you are actually buying
A diversified fund holds bonds and shares together in one product, and the manager decides the mix.
That is genuinely useful if you want both and would rather not think about the split. But you can also hold a bond fund and an equity fund yourself, choose the proportion, and see both sets of fees.
Most people treat the three categories as a ladder — money market, then bonds, then diversified, each paying more than the last. On this evidence the third rung is not higher than the second. It is differently shaped: more upside in a good year, more to give back in a bad one, and over six years about half a point of difference.
The whole list
Fund | Age | Year to date | Last 12 months | A year since launch |
FCP Kori Sérénité | 1.3 yrs | 4.27% | 4.05% | 11.23% |
FCP Harvest Diversifié | 1.3 yrs | 4.73% | 5.03% | 8.92% |
FCP AB Avenir | 3.1 yrs | 6.24% | 7.36% | 8.77% |
FCP Corridor Rendement | 6.9 yrs | 13.12% | 14.31% | 7.29% |
FCP Elite Capital Record | 3.9 yrs | 5.15% | 6.32% | 6.87% |
FCP AB Diversifié | 3.2 yrs | 3.82% | 4.59% | 4.39% |
FCP ESS Premium Personnel | 0.5 yrs | — | — | under 1 yr |
FCP ESS Premium Personnel appears without figures. At six months old it has no twelve-month record and no usable average yet.
Before you move any money
These figures come from net asset values published in the BVMAC bulletin, dated between 23 and 30 October 2026, so the funds are not all measured to the same day. One year is one year, and a period that favoured bonds will not repeat forever.
Ask the management company two things: what the fund's actual split between bonds and shares is, and what the entry and exit fees are. A fund holding 80% bonds is a different product from one holding 40%, and the table cannot tell you which you are looking at.
NB: Ranking based on NAV performance (excluding distributions).